.png)
How to use the series builder
What is the series builder?
The series builder is a blue sparkline 
Any field that uses the series builder will have an arrow ▼ on the right of the field, which opens a pop-up with more options. Note that the sparkline chart is only for the first 10 years, so if you want to see more years, open the pop-up.
Fields in the series builder pop-up
The series builder pop-up allows you to edit more options and see the projected future values. To open the series builder pop-up, click the arrow ▼ on the right of the series builder field:

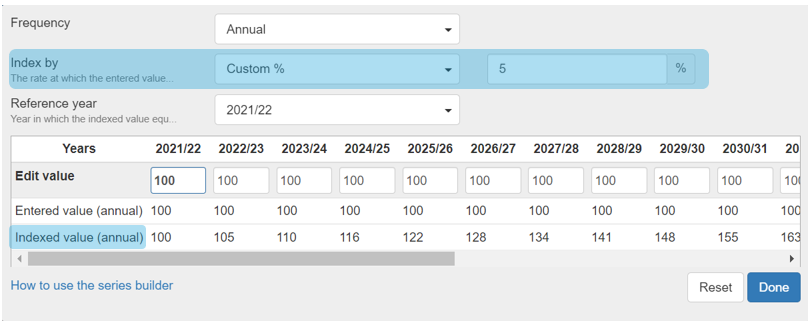
Clicking the arrow will show a pop-up like this where you can set more options (note that different fields may not show all the options listed below because they are not relevant to the field):
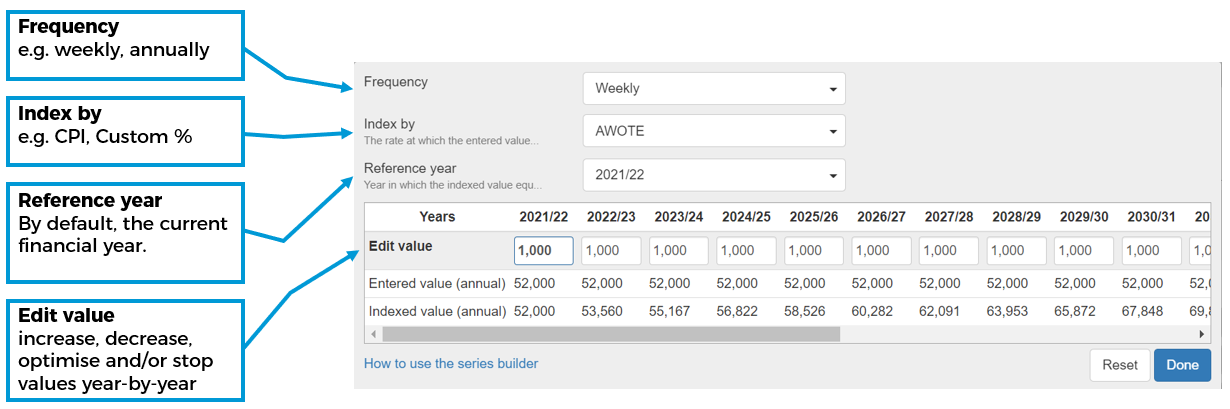
'Frequency' field in the series builder pop-up
In the series builder pop-up:
You can edit the Frequency field. The default is 'Annual', but you can choose a variety of options from weekly to every 5 years. You can also choose 'One off' for an expense that doesn't occur every year.
The value you enter should match the frequency. e.g. if you enter a weekly frequency, enter the weekly value to match.
If you choose a frequency that isn't annual, you can see the total annual value and the years it is applied in the Entered value (annual) row in the series builder pop-up.
Note that for some fields, you will not see the Frequency field because it is always 'annual' by default (e.g. for interest rates).
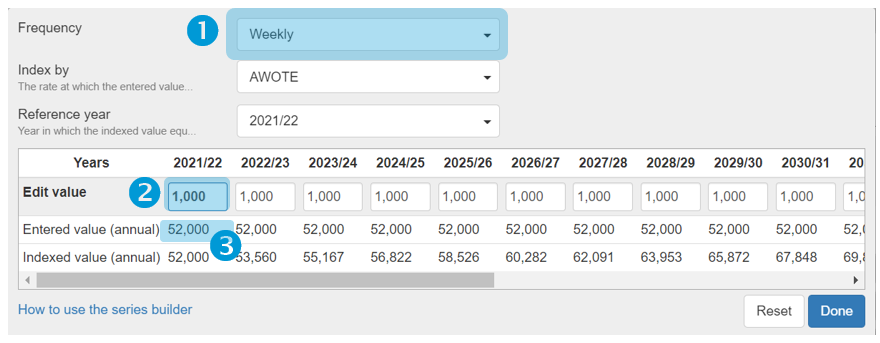
In this example, you can see that the Frequency has been entered as 'Monthly' and the value has been entered as $1,000, so the Entered value (annual) is given as $12,000 (i.e. $1,000 x 12 months):
'Index by' field
The Index by field is the rate at which the entered values increase. Often, the index will be pre-filled with a default value, however you have the option to change it. Some examples of why a value should be indexed are:
An individual who earns a salary can expect pay rises in future years, you can choose the Index by field to increase the amount by a percentage each year.
For Expenses you can expect prices to rise with inflation (CPI)
For Properties you can expect their value to grow over time
You can also use this field to enter asset depreciation. See How to enter depreciation.
You can see the projected indexed value in the Indexed value (annual) row
For the options that have a name (i.e. CPI, AWOTE, House Price Growth), Optimo Financial has default values which you can see in the assumptions report (for more, see How to see and edit the assumptions). If you wish to use different values, you can use the the Custom % frequency to set any percentage. You can also contact Optimo Financial to override the default series values for your organisation.
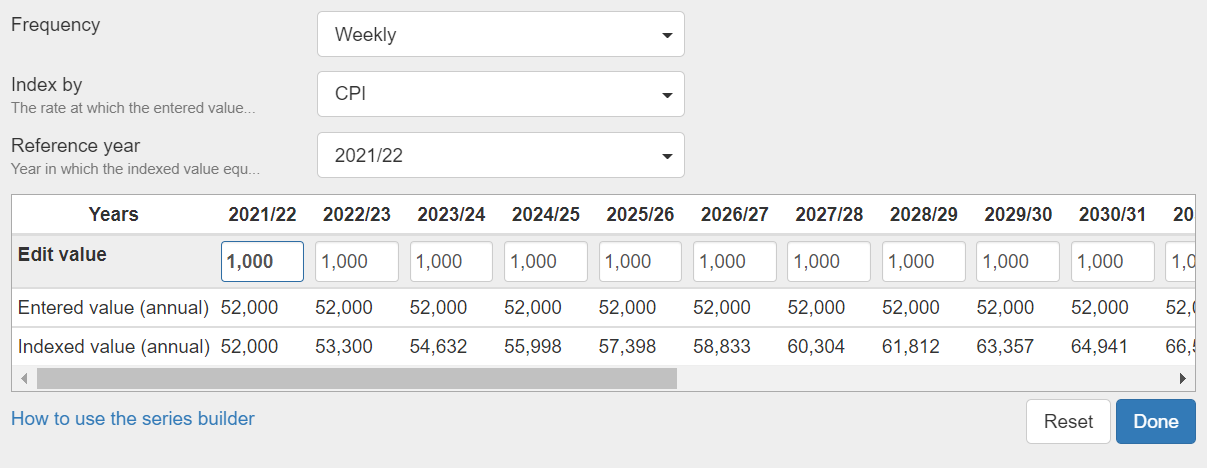
In this example, you can see that the Index by value has been given a custom value of 5%, and in the Indexed value (annual) line you can see the amount increasing by 5% every year:
'Reference year' field
The Reference year field is the year in which the indexed value equals the value you entered. By default, the first financial year of the analysis is chosen, however you can change this if required. You should only do this if you are sure the value is in future dollars, otherwise it is safer to keep the reference year as the default and apply the indexation.
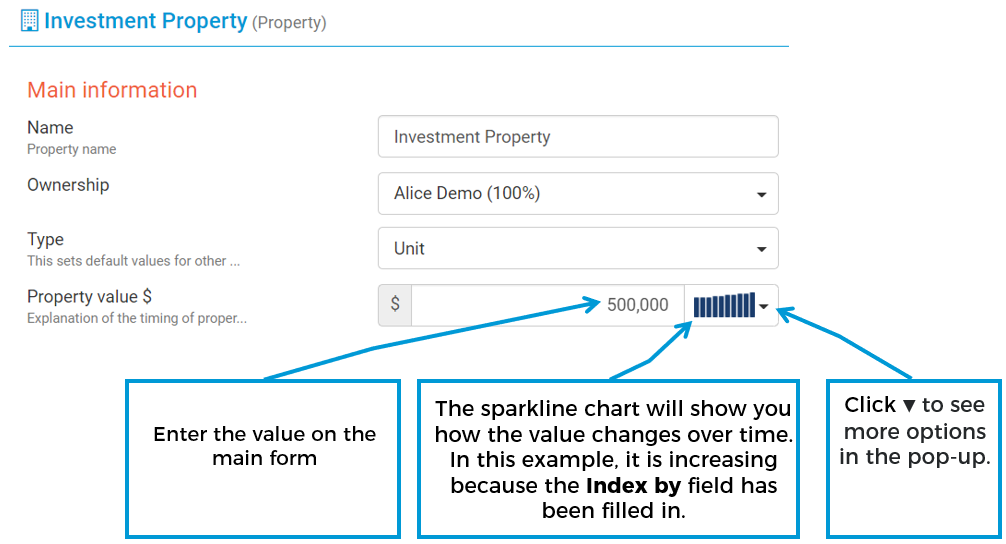
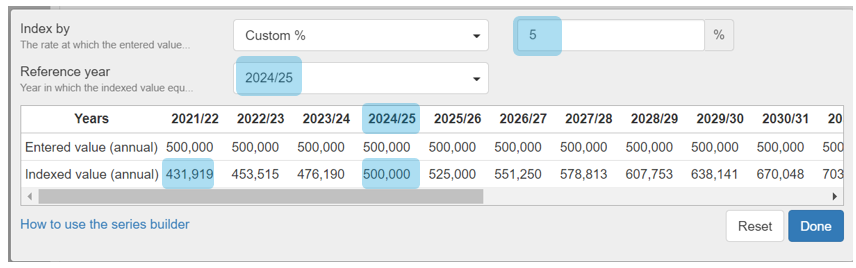
In this example, the individual wants to buy a property worth $500,000 in 2024/25 and they have assumed that property prices will increase by 5% a year, so:
On the main form, fill in the property value with $500,000
In the pop-up:
The Index by field is filled in with 5%
The reference year is given as 2024/25
In the Indexed value (annual) row in the table you can see:
The value is $500,000 in 2024/25 (the same year as the entered reference year)
The value in 2021/22 is $431,919. So with 5% pa indexation, this is projected to become $500,000 in 2024/25
'Edit value' and the 'Expanded values' table
If you'd like to enter values based on someone's age, you can use the Age lookup table to find the corresponding financial year. For more, see How to read the Age Lookup table.
The Expanded values table has the following rows:
Edit value - The Edit value row lets you change the values in future years. You should always enter the unindexed value. For more examples of using this field see:
To stop a value, put zero. For more examples, see How to stop a value in the series builder
To increase or decrease a value (e.g. changing to a part-time salary), put the new value in the relevant year. For more examples, see How to increase or decrease a value in the series builder
To allow a value to be optimised, put dash ( - ). For more examples, see How to allow a value to be optimised in the series builder by using dash
Entered value (annual) - If you chose a frequency that is different from 'Annual' (e.g. weekly), then this row will show the annual value. It does not have the indexation applied.
Indexed value (annual) - This is the same as the Entered value (annual), except that the value will be indexed by the percentage that was entered in the Index by field. The values in these two rows will match in the year that was entered in the Reference year field