.png)
How to read the websolve results
Navigating in the results
| 1 | Navigate to the results |
Can't see any results?If you cannot see any results, see How to solve a scenario to get results |
|---|---|---|
| 2 | Check the date of the results |
|
| 3 | Strategy summary sub-step (under the Results step on the top menu) | At the Strategy summary sub-step (under the Results step on the top menu), you can review the main points for each item in the case and make a note of anything that you might want to investigate in more detail. On the Strategy Summary sub-step, you will see:
|
| 4 | Cash flows & action items sub-step (under the Results step on the top menu) | At the Cash flows & action items sub-step (under the Results step on the top menu), you can review the strategy in more detail. In the Cash flows report:
In the Action items:
|
| 5 | Detailed reports sub-menu (on the Results step on the top menu) | Go to the Results step on the top menu, and then choose the Detailed reports sub-step. On this page, there is a comprehensive collection of detailed reports that can give you more information on how the numbers were calculated (see below for more information on this section). |
| 6 | Save the scenario results in a Document | At the Documents sub-step, you can download the results into an MS Word document. For more see How to download results into a document (Strategy Paper, SOA (Statement of Advice) Foundation document, Strategy Comparison) |
| 7 | If you have multiple scenarios, compare the outcomes | For more, see Compare step |
Reading the detailed report tables
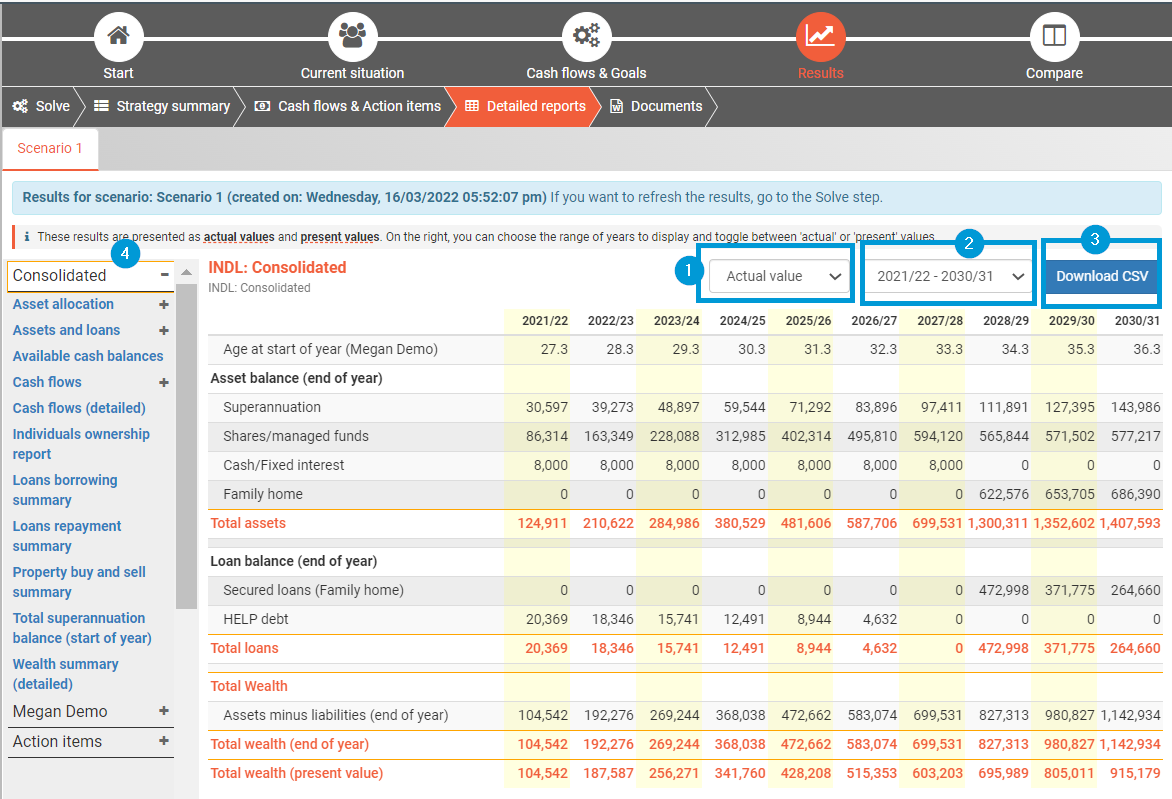
At the Results > Detailed reports step, you should see the following options (the numbers are labelled in the image):
Actual value or Present value - ‘Actual values’ are nominal dollars, that is, the dollar value that is current for the future year listed in the report. ‘Present values’ discount future values to today’s dollars using the CPI value given in the ‘Assumptions’ section of the strategy summary. Present values provide a better perspective when projecting many years into the future.
Year range - you can choose 10 year increments or all years in the analysis.
Download CSV - once you've selected a report, you can download it in CSV (comma separated values) file format. (it's best to change the year range to 'All' before downloading)
Detailed reports - On the left, you have a tree menu - note that you can click the headings (e.g. 'Consolidated') for a wealth summary.
If you have a cash shortfall, see How to investigate and fix cash shortfalls.
Particularly useful detailed reports
Description | Useful for | |
|---|---|---|
CONSOLIDATED REPORTS If the case has a couple, then consolidated reports are for both individuals. If the case has a single individual, then the consolidated reports are the same as for the 'Individual' reports. | ||
Consolidated | This wealth summary report with lists projected end of year balances for assets, liabilities, superannuation, SMSFs and Trusts, plus total net wealth. It conflates by category (e.g. there is 'Secured Loans' row that has the total balance of all the secured loans in the case. |
|
Wealth summary (detailed) | This is similar to the 'Consolidated' report, except it lists each item, instead of listing by asset type. |
|
Cash flows (detailed) | This report lists each transaction (Revenue and Expenditure) outside super for all individuals. |
|
Available cash balances | If you filled in a value for the Cash reserve goal, this report will show where the cash reserve is kept |
|
ACTION ITEMS This is a heading on the left menu: | ||
There is an action item report for each year | For each year of the analysis, the action items describe key actions in plain english and gives some additional context. |
|
INDIVIDUAL REPORTS On the left menu, if you scroll down, you will see headings with the name of each individual in the case. Individuals will have the following reports. | ||
Cash flows > Super deposits summary | Lists the individual's concessional and non-concessional super deposit limits and projected contributions |
|
Tax (and sub-reports) | Shows the taxable income, deductions and tax liability for the individual. |
|
Government Pension (and sub-reports) | Shows the government Age Pension the individual is projected to receive and the calculations used to arrive at this value, including the income and assets tests. |
|